Shift
Making Telecom Data Visible, Understandable and Sustainable
April — May 2025
My role
UX Research
Prototyping
Usability Testing
Team
Luana Bistane
Sofia Aguiar
Nelson Delicado
01. The Challenge
Telecom providers face a growing challenge: monitoring customer experience in real time while using historical data to improve services. Current systems struggle to represent these time-based dimensions, limiting both insight and action.
This capstone began with an open brief from Nokia via the Carnegie Mellon Portugal program: to explore how time could be visualized and manipulated in telecom experience monitoring. There was no existing product — only a complex, multi-layered challenge.
Through research and ideation, we proposed SHIFT: a new, standalone product that could either serve users directly or be licensed by telecom operators. Its goal: bridge the gap between people and data with clarity, transparency, and sustainability.
Objectives
This project set out to explore how telecom experience data could be made more useful and engaging — across real-time, historical and predictive timelines.
Key goals:
- Help users and providers act on service data, not just observe it
- Combine user feedback with automated monitoring
- Introduce sustainability insights into network usage
- Explore intelligent, visual ways to guide user behavior
The Process
02. Research
2.1 Desk Research
We analyzed the telecom landscape in Portugal, focusing on digital penetration, tech literacy, and sustainability trends.
- 8+ million smartphone users
- 17+ million active SIM cards
- High daily dependence on digital services
We also studied best practices from apps in energy, health, mobility, and finance — focusing on data visualization and user feedback.
2.2 Survey
We launched an online survey with 239 responses to map behaviors, perceptions and expectations. Results revealed difficulties understanding technical data, low engagement with digital sustainability, and distrust in current telco apps.
- What are the main concerns of SHIFT’s target users?
- How can SHIFT better understand and serve them?
- How should the app promote and increase sustainable behaviors? Results revealed difficulties understanding technical data, low engagement with digital sustainability, and distrust in current telco apps.
We identified clear patterns of frustration and areas of opportunity:
- Users struggled with understanding their data
- Low awareness of environmental impact
- Frustration with unclear billing
- Lack of effective feedback channels
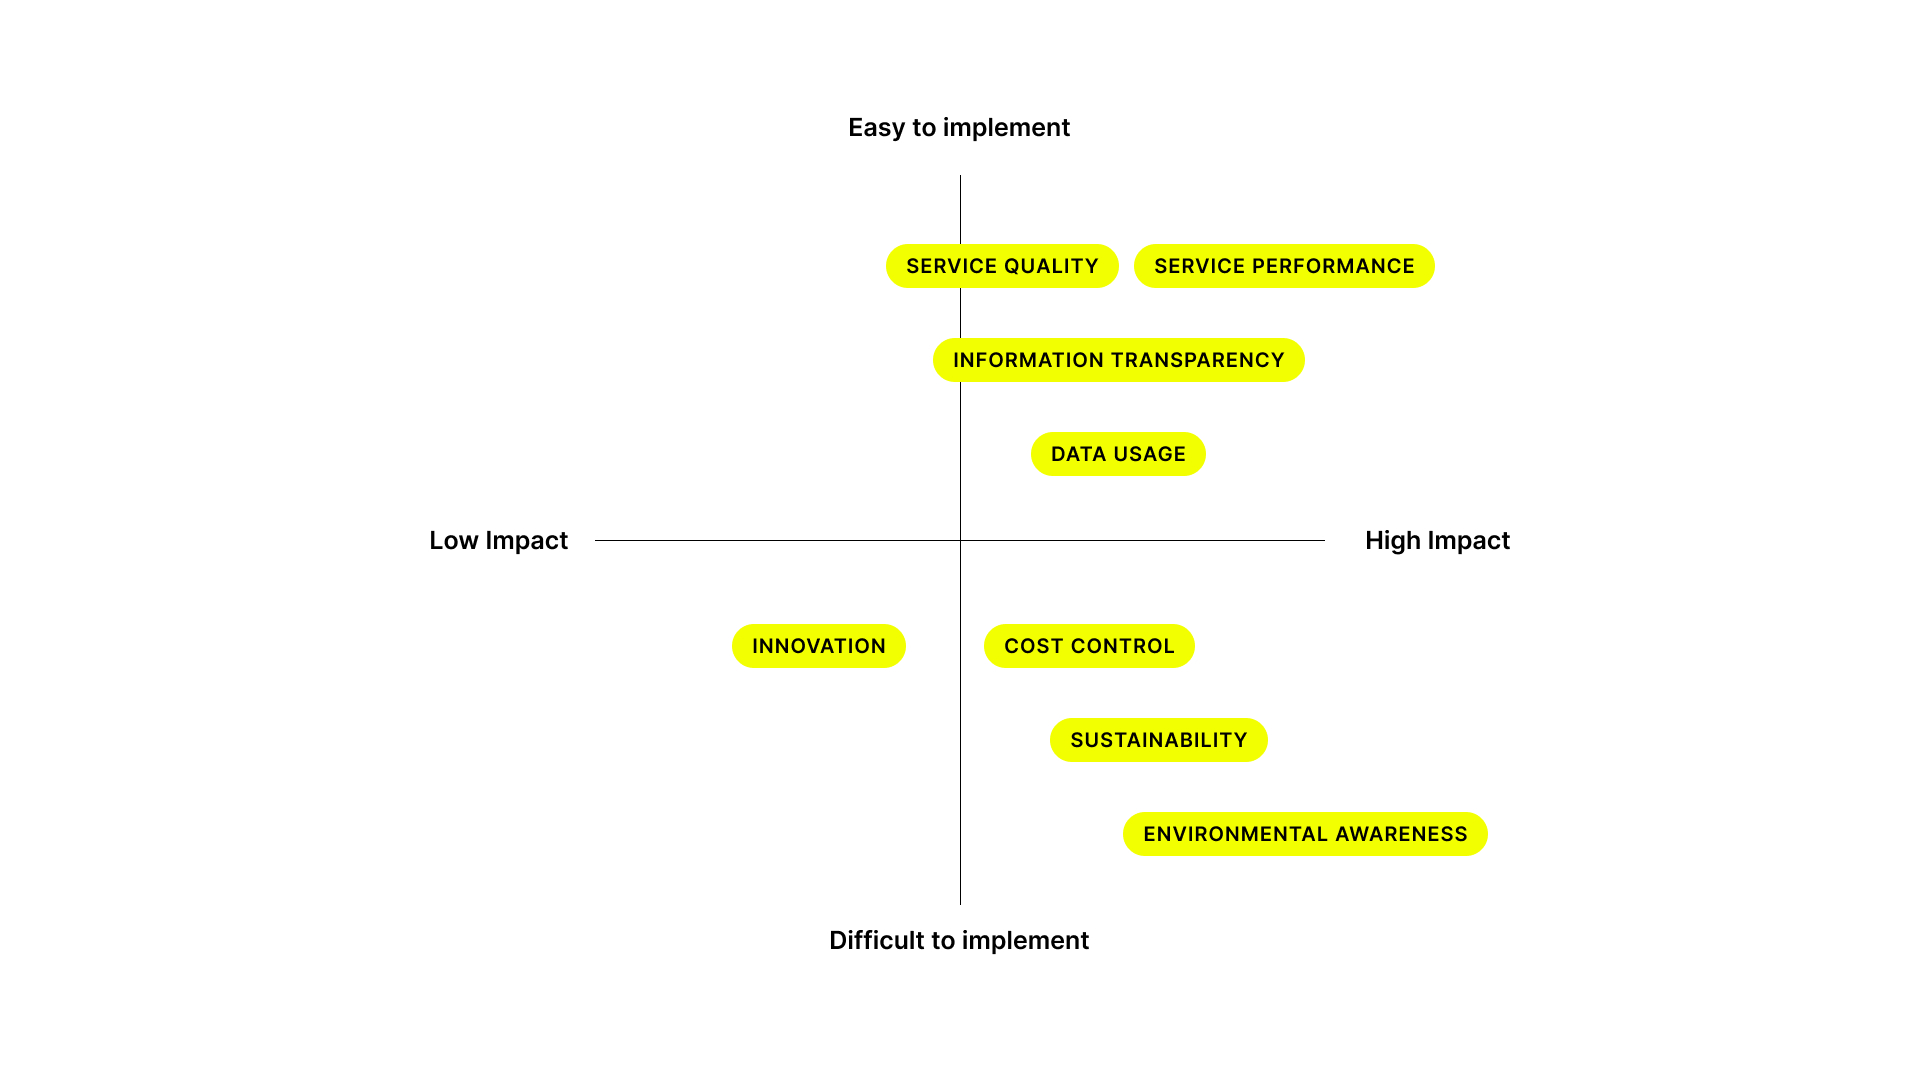
Opportunities for innovation:
- Translate technical data into accessible visuals
- Educate and engage through gamification and feedback
- Use proactive notifications and clear dashboards
- Reward contributions with tangible benefits
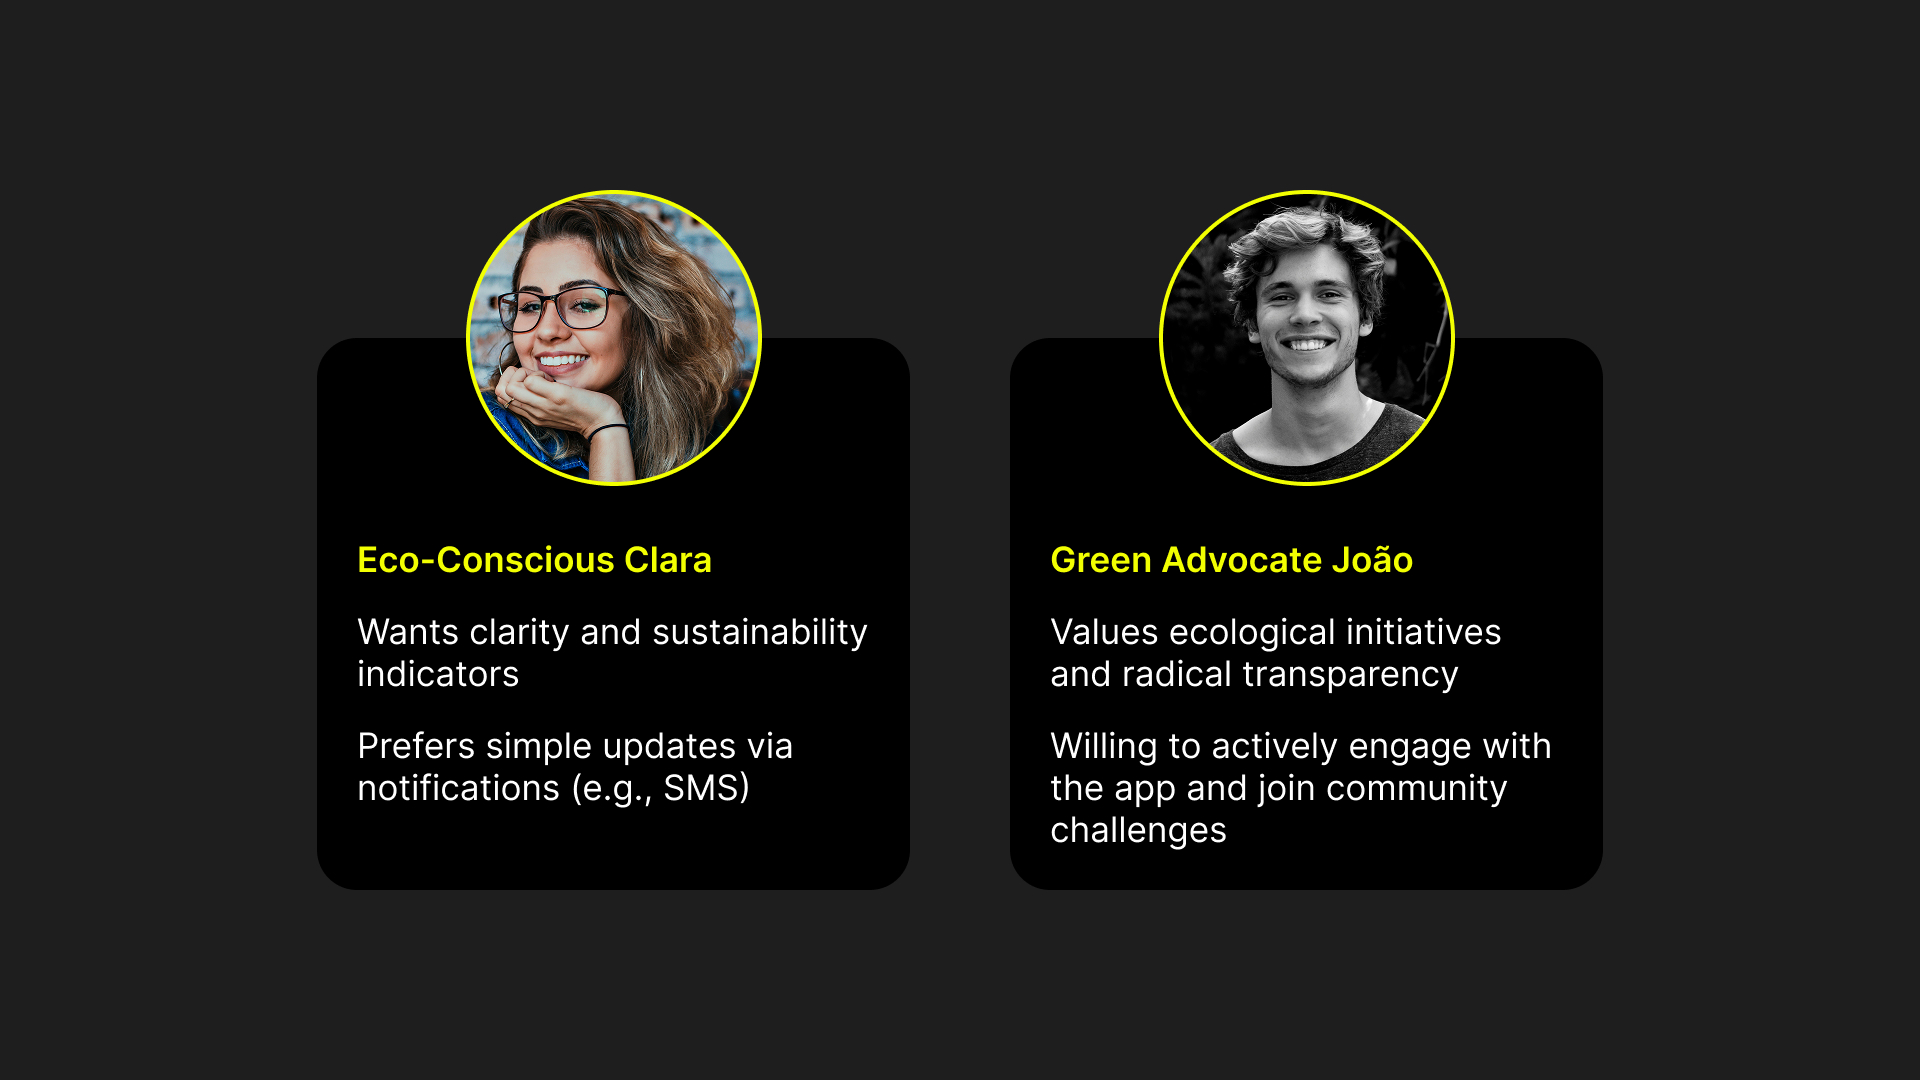
2.3 Personas
From this, we created personas like “Eco-Conscious Clara” and “Green Advocate João” — users who care about service quality and are open to sustainable behavior.
2.4 Benchmark
We analyzed apps from major Portuguese telcos (MEO, NOS, Vodafone) and others like Speedtest, Galp, EDP, and Google Maps. None of them clearly integrated technical, environmental, and time-based data.
This opened space for a solution that is independent, transparent and educational — placing the user in an active role.
03. Ideation
3.1 Problem Definition
Lack of clarity in network data makes it harder for users to understand performance or environmental impact. This limits engagement. There’s an opportunity to promote more conscious habits through accessible information and interactive tools.
How might we...
How might we make telecom data more understandable, actionable and engaging — so users can make better, more sustainable decisions?
3.2 Brainstorming
Our ideation workshops allowed us to:
- Explore new ways to visualize time-based data
- Design models for active participation (social, gamified)
- Define the technical and functional scope for the MVP
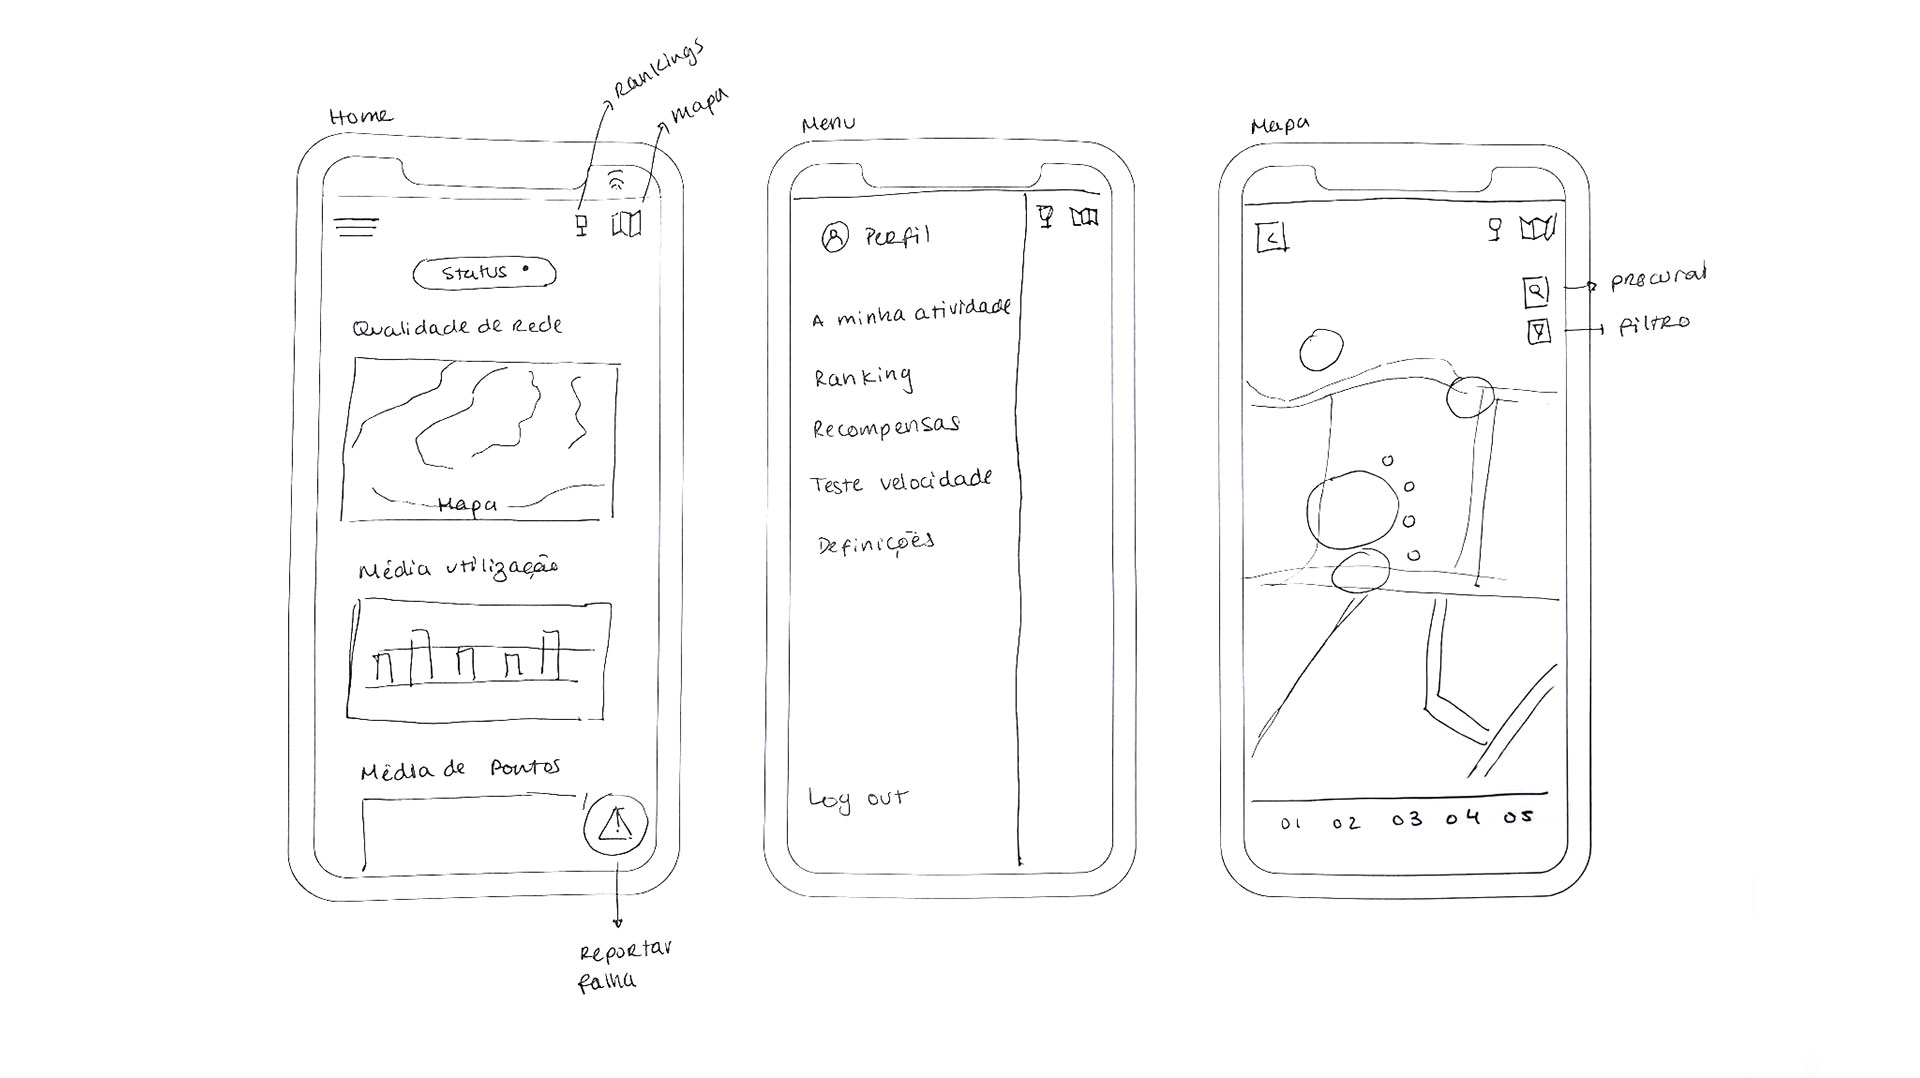
3.3 Initial Prototypes & Success Criteria
Early testing focused on:
- Clarity and readability of visualizations
- Perceived usefulness of the features
- Engagement with the value proposition
04. The Solution
4.1 UI & Design Decisions
We created a visual identity for SHIFT that reinforces its sustainability focus. The interface defaults to dark mode to reduce screen energy consumption and align with the theme of digital responsibility. A vibrant green accent color was chosen to provide contrast and act as a visual signal of “energy” and impact — illuminating the interface and reinforcing positive, sustainable action.

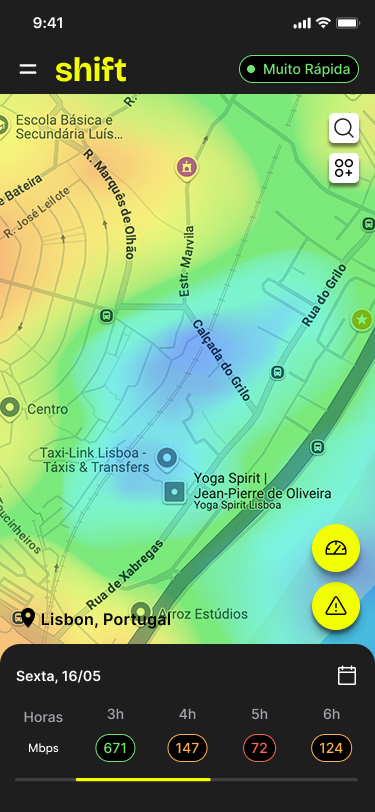
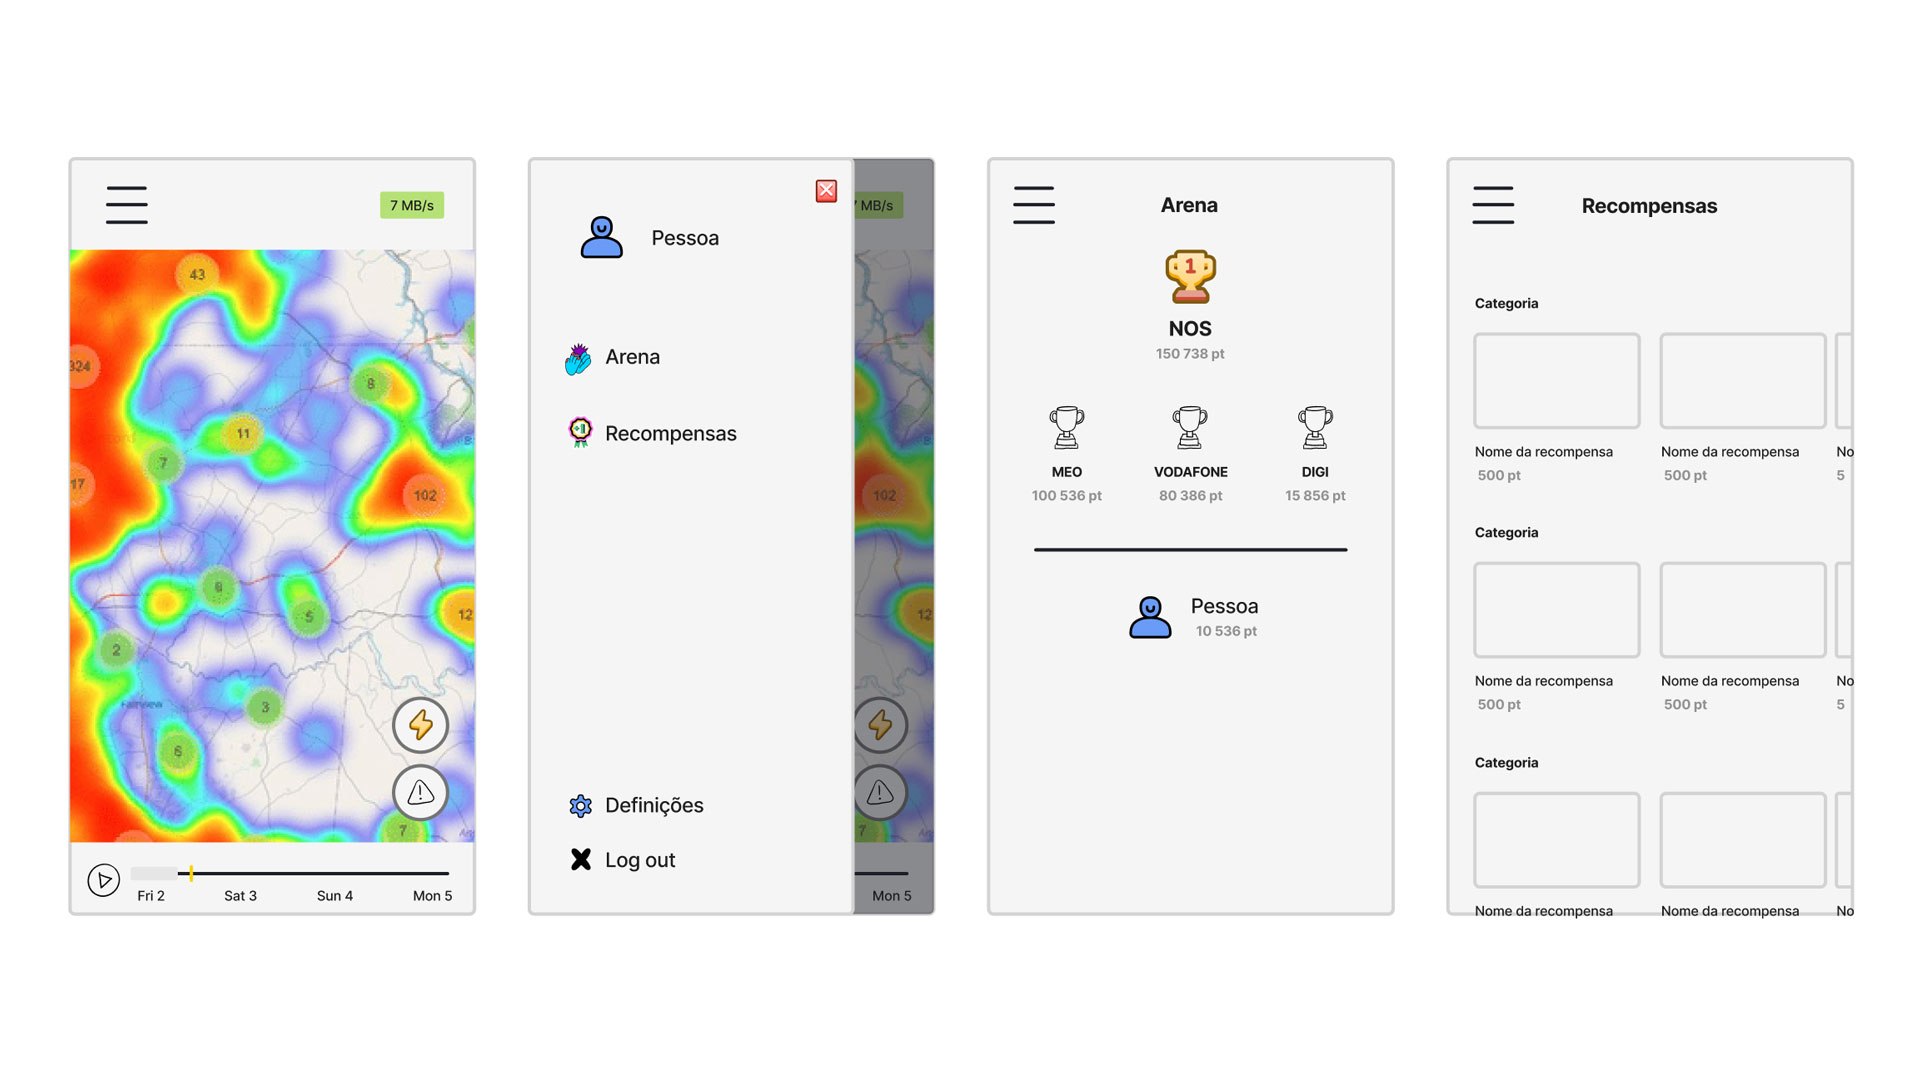
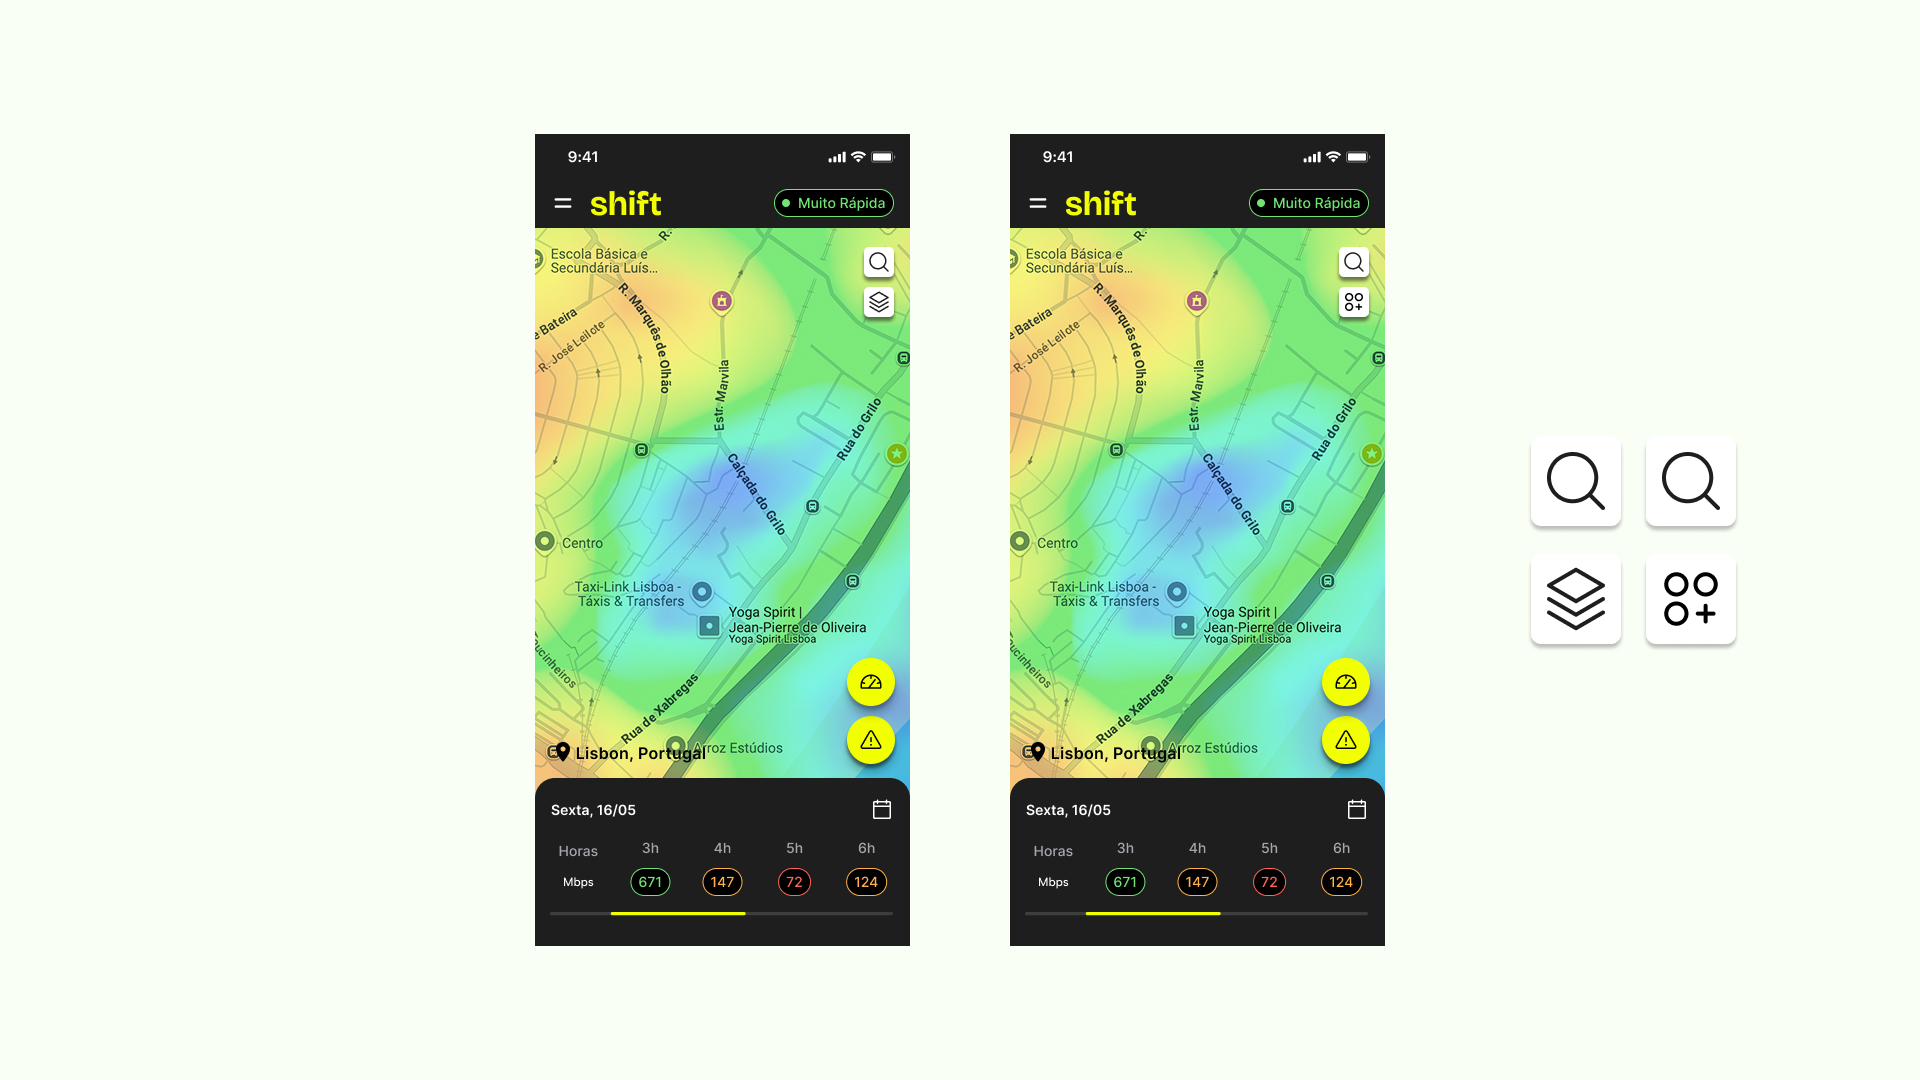
Network Quality Heatmap
Interactive heatmap showing real-time internet speed across locations. Users can explore by hour and see data performance visually across the city.
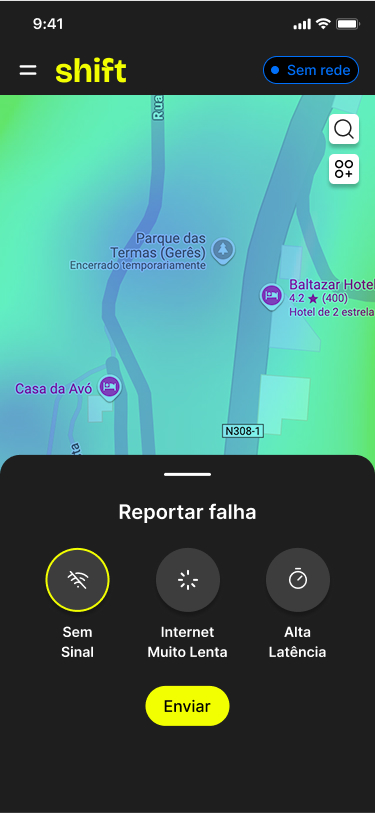
Report an Issue
Enables users to quickly report common network issues — such as no signal, slow internet, or high latency — directly from the coverage map.
Users are rewarded with points for contributing to the improvement of service visibility.
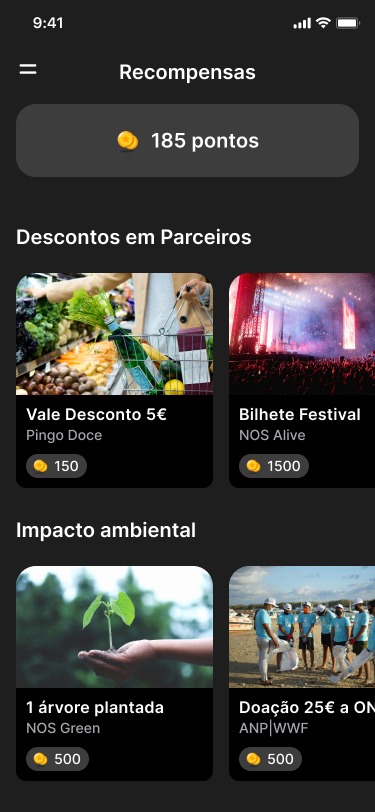
Rewards Screen
Gamified rewards system where users can redeem points for eco-friendly products, event tickets, or environmental donations (e.g., tree planting, NGO support).
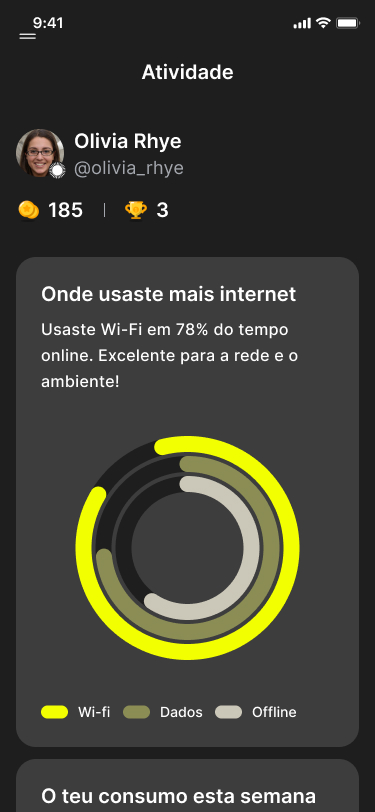
Activity Screen
Shows how the user accessed the internet (Wi-Fi, mobile data, offline) and highlights the environmental benefit of using Wi-Fi more often. Includes profile, points, and rewards earned.
4.2 Testing & Iterations
We tested with users in different stages. The solution evolved through feedback, with three major adjustments:
- Highlighting environmental indicators: Many users didn’t recognize SHIFT’s main value. We moved the sustainability layer to the top of the dashboard.
- Simplified icons and language: Visual elements were redesigned and supported by light, contextual onboarding.
- Supporting digital literacy: Instructions were spread along the journey, matching the user’s pace.

Iteration 1:
Reordering Sustainability IndicatorsUsers didn’t immediately understand SHIFT’s unique value. We moved the sustainability metrics (carbon footprint, energy usage) to the top of the dashboard.
Rationale: many apps already show network performance — what makes SHIFT different is the environmental layer.
Iteration 2:
Users struggled to recognize the icon used to toggle data layers on the map.
We redesigned the icon to make its function more intuitive and aligned it with common interface patterns.
Iteration 3:
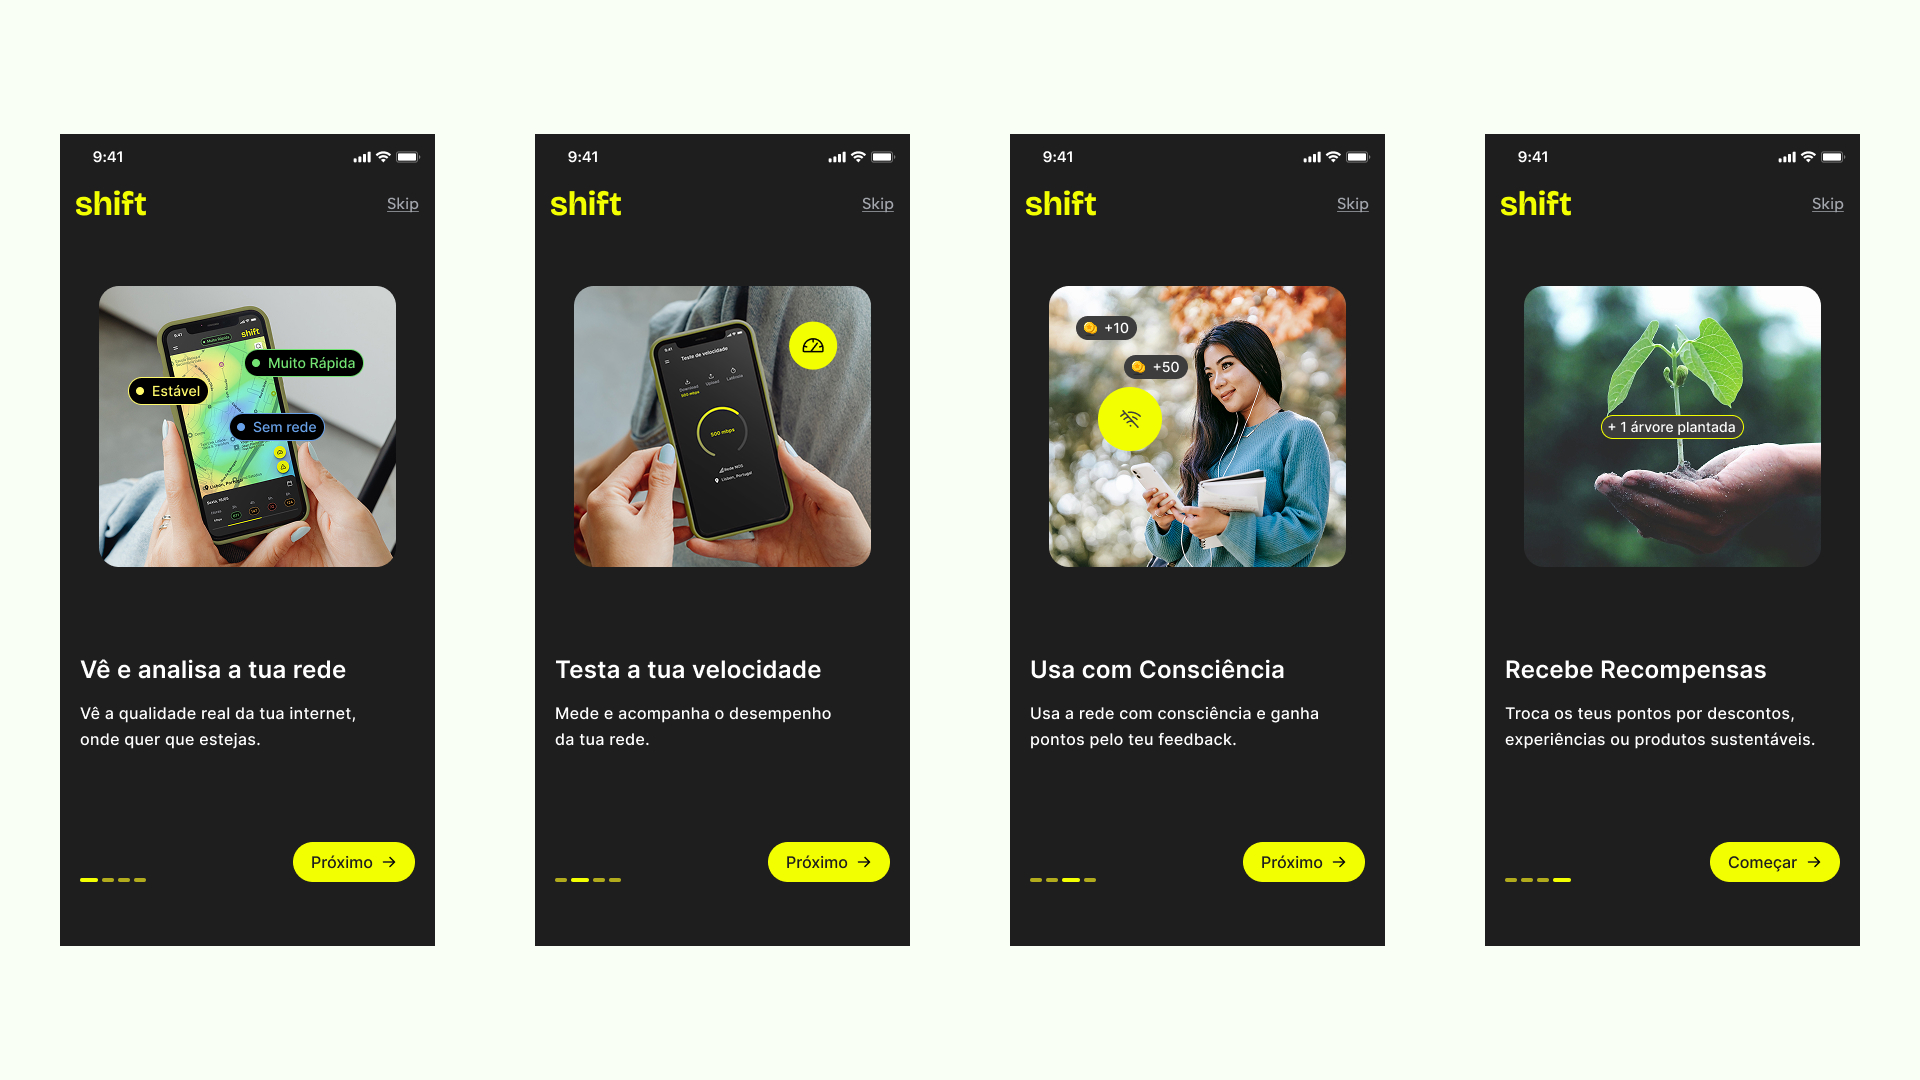
Users often skipped the initial tutorial screens.
We replaced static onboarding with contextual tips shown progressively throughout the app experience — offering guidance without overwhelming new users.
4.3 Validated Solution
SHIFT is built on three strategic pillars:
- Accessible information: Technical metrics are translated into clear visualizations
- Sustainable usage: An environmental layer with personalized recommendations
- Gamified engagement: Actions are rewarded through challenges, badges, and ESG-aligned campaigns
The solution was presented to stakeholders in pitch format and validated in terms of technical feasibility and strategic relevance for the sector.

05. Impact and Future
SHIFT is more than an app — it’s a new way of relating to digital services.
User validation showed strong alignment with expectations: more clarity, more engagement, more awareness. Based on this, we built a phased rollout plan:
- 0–6 months
Soft launch at cultural events and pilot tests with early users - 6–18 months
National rollout, ESG marketplace launch, and public partnerships - 18–36 months
White-label licensing for telcos, custom B2B dashboards, and international scaling (e.g., Spain, Brazil)
Key metrics: NPS, 30-day retention, adoption of sustainable features, app store ratings
06. Conclusion
More than a design exercise, SHIFT was a critical reflection on the role of data in the digital experience.
We started with a systemic issue — the opacity of telco services — and responded with a user-centered solution that brought clarity, agency, and awareness.
This project required balancing vision with viability, and tech with real-world understanding. Designing services is also about designing relationships — with data, with systems, and with the planet.
SHIFT doesn’t solve everything, but it shows a path forward: a more transparent, sustainable, and empowering digital experience.

From left to right: Luana Bistane, Sofia Aguiar, Mariana Pato, Nelson Delicado, Sonia Rafael, João Ferreira, Augusto Esteves